The Cluster You Do Not Watch
August 19, 2026
I almost never open Grafana any more. This is the operations architecture that made that true, on under US$10 a month of infrastructure — an agent that reads everything and writes nothing directly, alerts precise enough to act on, repairs that must prove they are safe before running, and one rule that turns out to be load-bearing: a check that cannot fail is not a check. None of it depends on which Kubernetes you run.
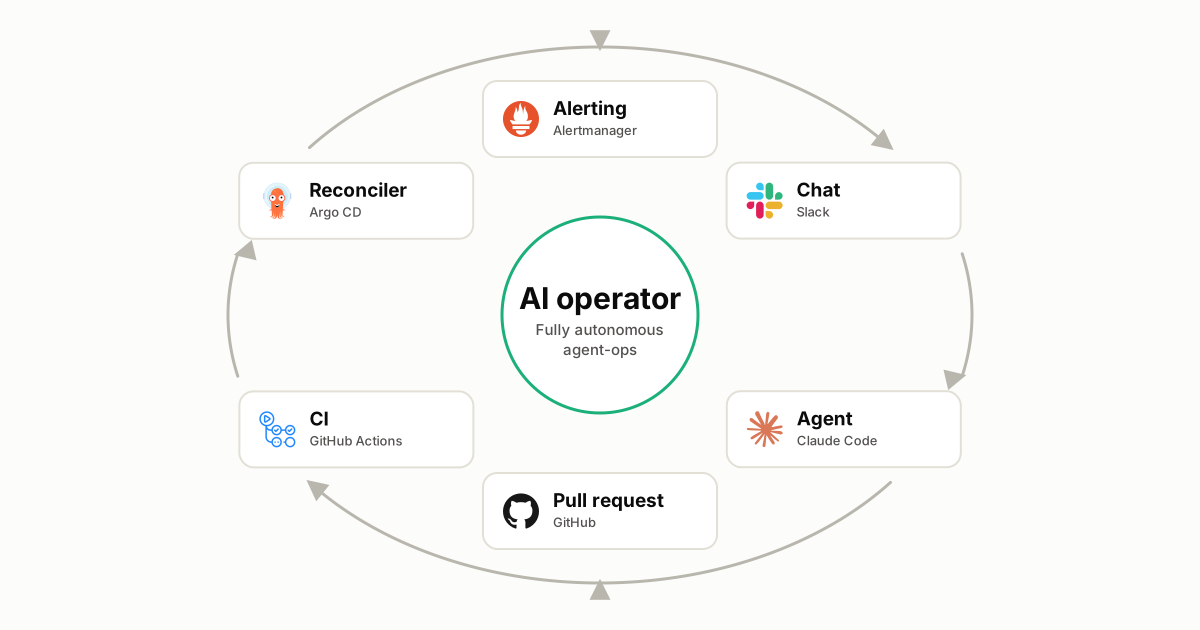
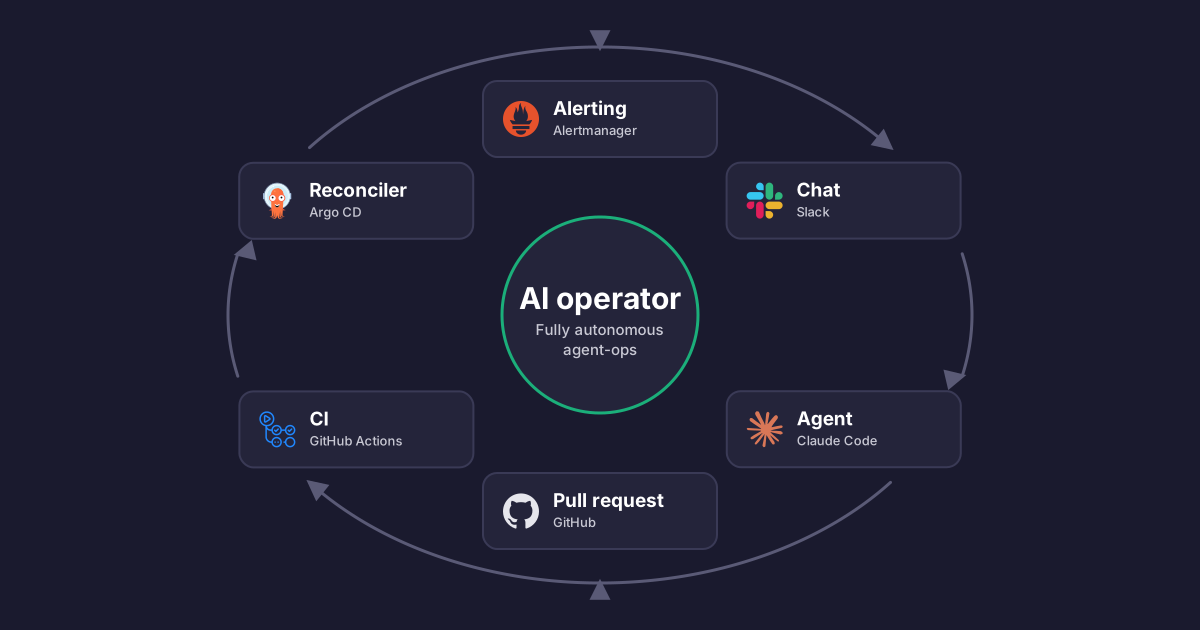
An operations loop drawn as a ring around a central AI operator: alerting into chat, into an agent, into a pull request, through CI, into a reconciler, and back around.
The best compliment I can pay our monitoring is that I have stopped looking at it.
That sounds like neglect, and for most of my career it would have been. A dashboard is a confession of uncertainty: you build one because you do not know in advance which number will matter, so you put forty of them on a wall and train your eyes to notice when the shape changes. It works, in the sense that a smoke detector made of a person sniffing the air works. It also means the quality of your operations is bounded by how much attention you are willing to spend, and attention is the one resource that does not scale with the fleet.
The alternative is not fewer signals. It is signals precise enough that a machine can act on them, arranged so that a human is interrupted only when the machine should not act alone.
This post is the architecture of that arrangement. Nothing in it depends on which Kubernetes you run. The examples come from our cluster, but the loop, the constraints, and the failure modes are the same whether your control plane is managed by Google, Amazon, Microsoft, or by you. The parts that differ are at the bottom of the post, deliberately, because they are the least interesting part.
The loop
The operational path is a ring (Fig. 1):
alerting → chat → agent → pull request → CI → reconciler → cluster, and the cluster is what the alerting watches.
An alert fires. It routes into a channel. An agent with live read access to your metrics, your logs, and the Kubernetes API picks it up, investigates, and — this is the part that took discipline — proposes a change instead of making one.
The agent reads everything and writes nothing directly. It holds no production credentials for mutation. Every change it wants lands as a pull request against the repository the reconciler already syncs from, which means review and CI sit in the path by construction rather than by policy. There is no mode where the agent is trusted enough to skip them, because there is no credential with which it could.
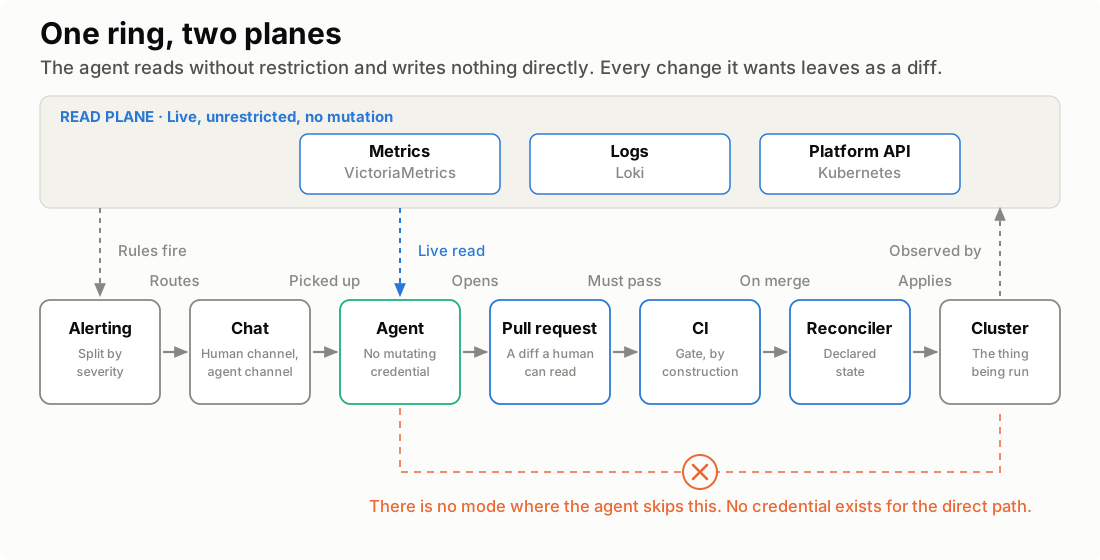
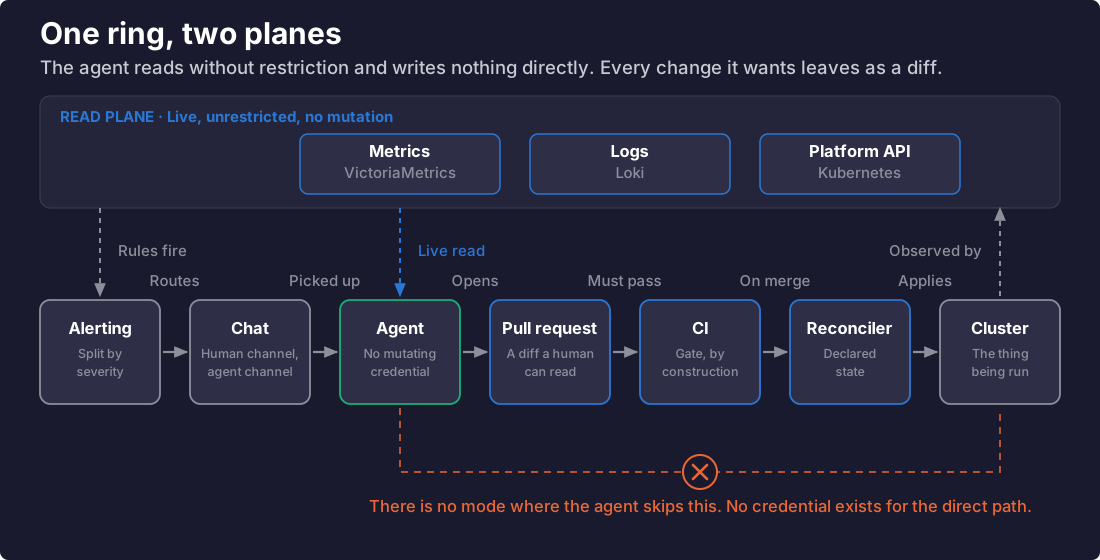
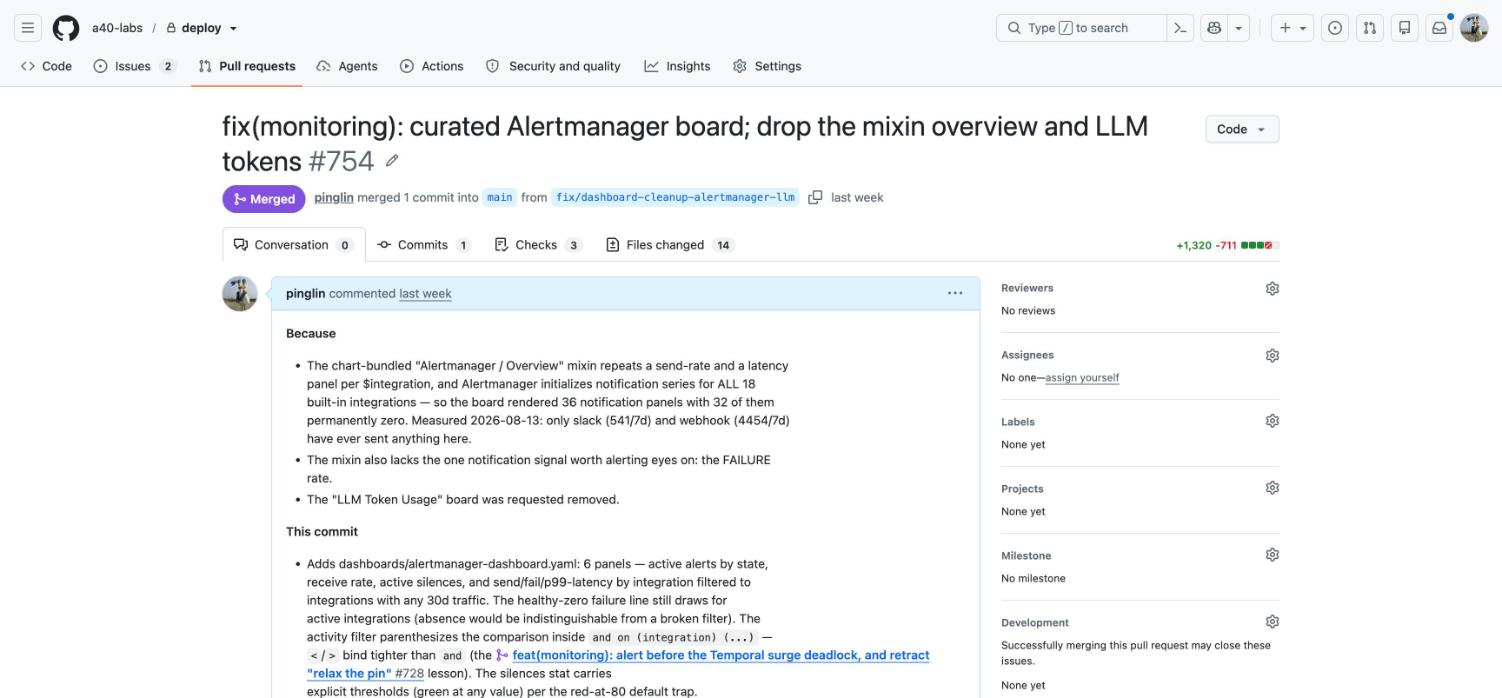
That constraint is doing more work than it appears. An agent that can edit production is only as safe as its best moment; an agent that can only open pull requests is as safe as your merge process, which you already trust with everything else. The GitOps repository was not adopted for the agent — it was already the source of truth — but it turned out to be the thing that makes an autonomous operator tractable. The agent inherits a review culture it did not have to be taught, and you keep every control you already had. Fig. 2 is one of those proposals, verbatim.
Concretely, that read plane is two datasources and an API: VictoriaMetrics for metrics, Loki for logs, and the platform’s own API for object state. Grafana sits on top of the first two, and it is there for me rather than for the agent — the agent queries the datasources directly, because a dashboard is a rendering decision, and anything reading renderings inherits every choice a human already made about what to display.
The log half is what separates an operator from a restart loop. Metrics say that something is wrong and when; they rarely say why. Almost every diagnosis here that ended in a durable fix ended in a log line — the error immediately before a flatline, the retry that never succeeded, the entry proving a counter had been reset by a restart rather than by the thing under investigation. An agent holding only alerts and metrics can report that a component stopped making progress. An agent that can also read that component’s logs from the minute before it stopped, and its peers’ across the same window, can say what stopped it — which is the difference between a pull request that restarts something and a pull request that changes a number.
Loki’s shape helps more than I expected it to. It indexes labels rather than log content, so a query has to name a stream — namespace, pod, container — before it can search inside one. For a human that is a mild annoyance. For an agent it is a guardrail: there is no cheap way to grep the entire fleet, so an investigation stays scoped to whatever alerted.
Any reconciler will do. Any chat surface will do. Either datasource is replaceable too, though having both is not — an operator that can see metrics and not logs is limited to noticing. The properties that matter are that the agent’s proposals are legible (a diff a human can read), gated (CI runs before merge), and reversible (git history) — and those are properties of the workflow rather than of any product in it.
Observability for humans
Dashboards and alert rules live in version control and are applied by the same reconciler as everything else. Dashboards as code, reviewed like code, arriving through the same pull request path.
The discipline that matters is not the storage format, though. It is curation over accumulation, and it is unnatural to sustain, because every individual panel is easy to justify and no individual panel is ever the problem. Vendor-bundled boards are the pathological case: they render a panel per label value, because they cannot know which values you have. A board meant to show notification health draws two panels for every integration the alerting system could have — most of them permanently empty on any given installation. Nothing is wrong with any panel. The board is still useless, because the ratio of signal to furniture has crossed the point where a human stops reading it.
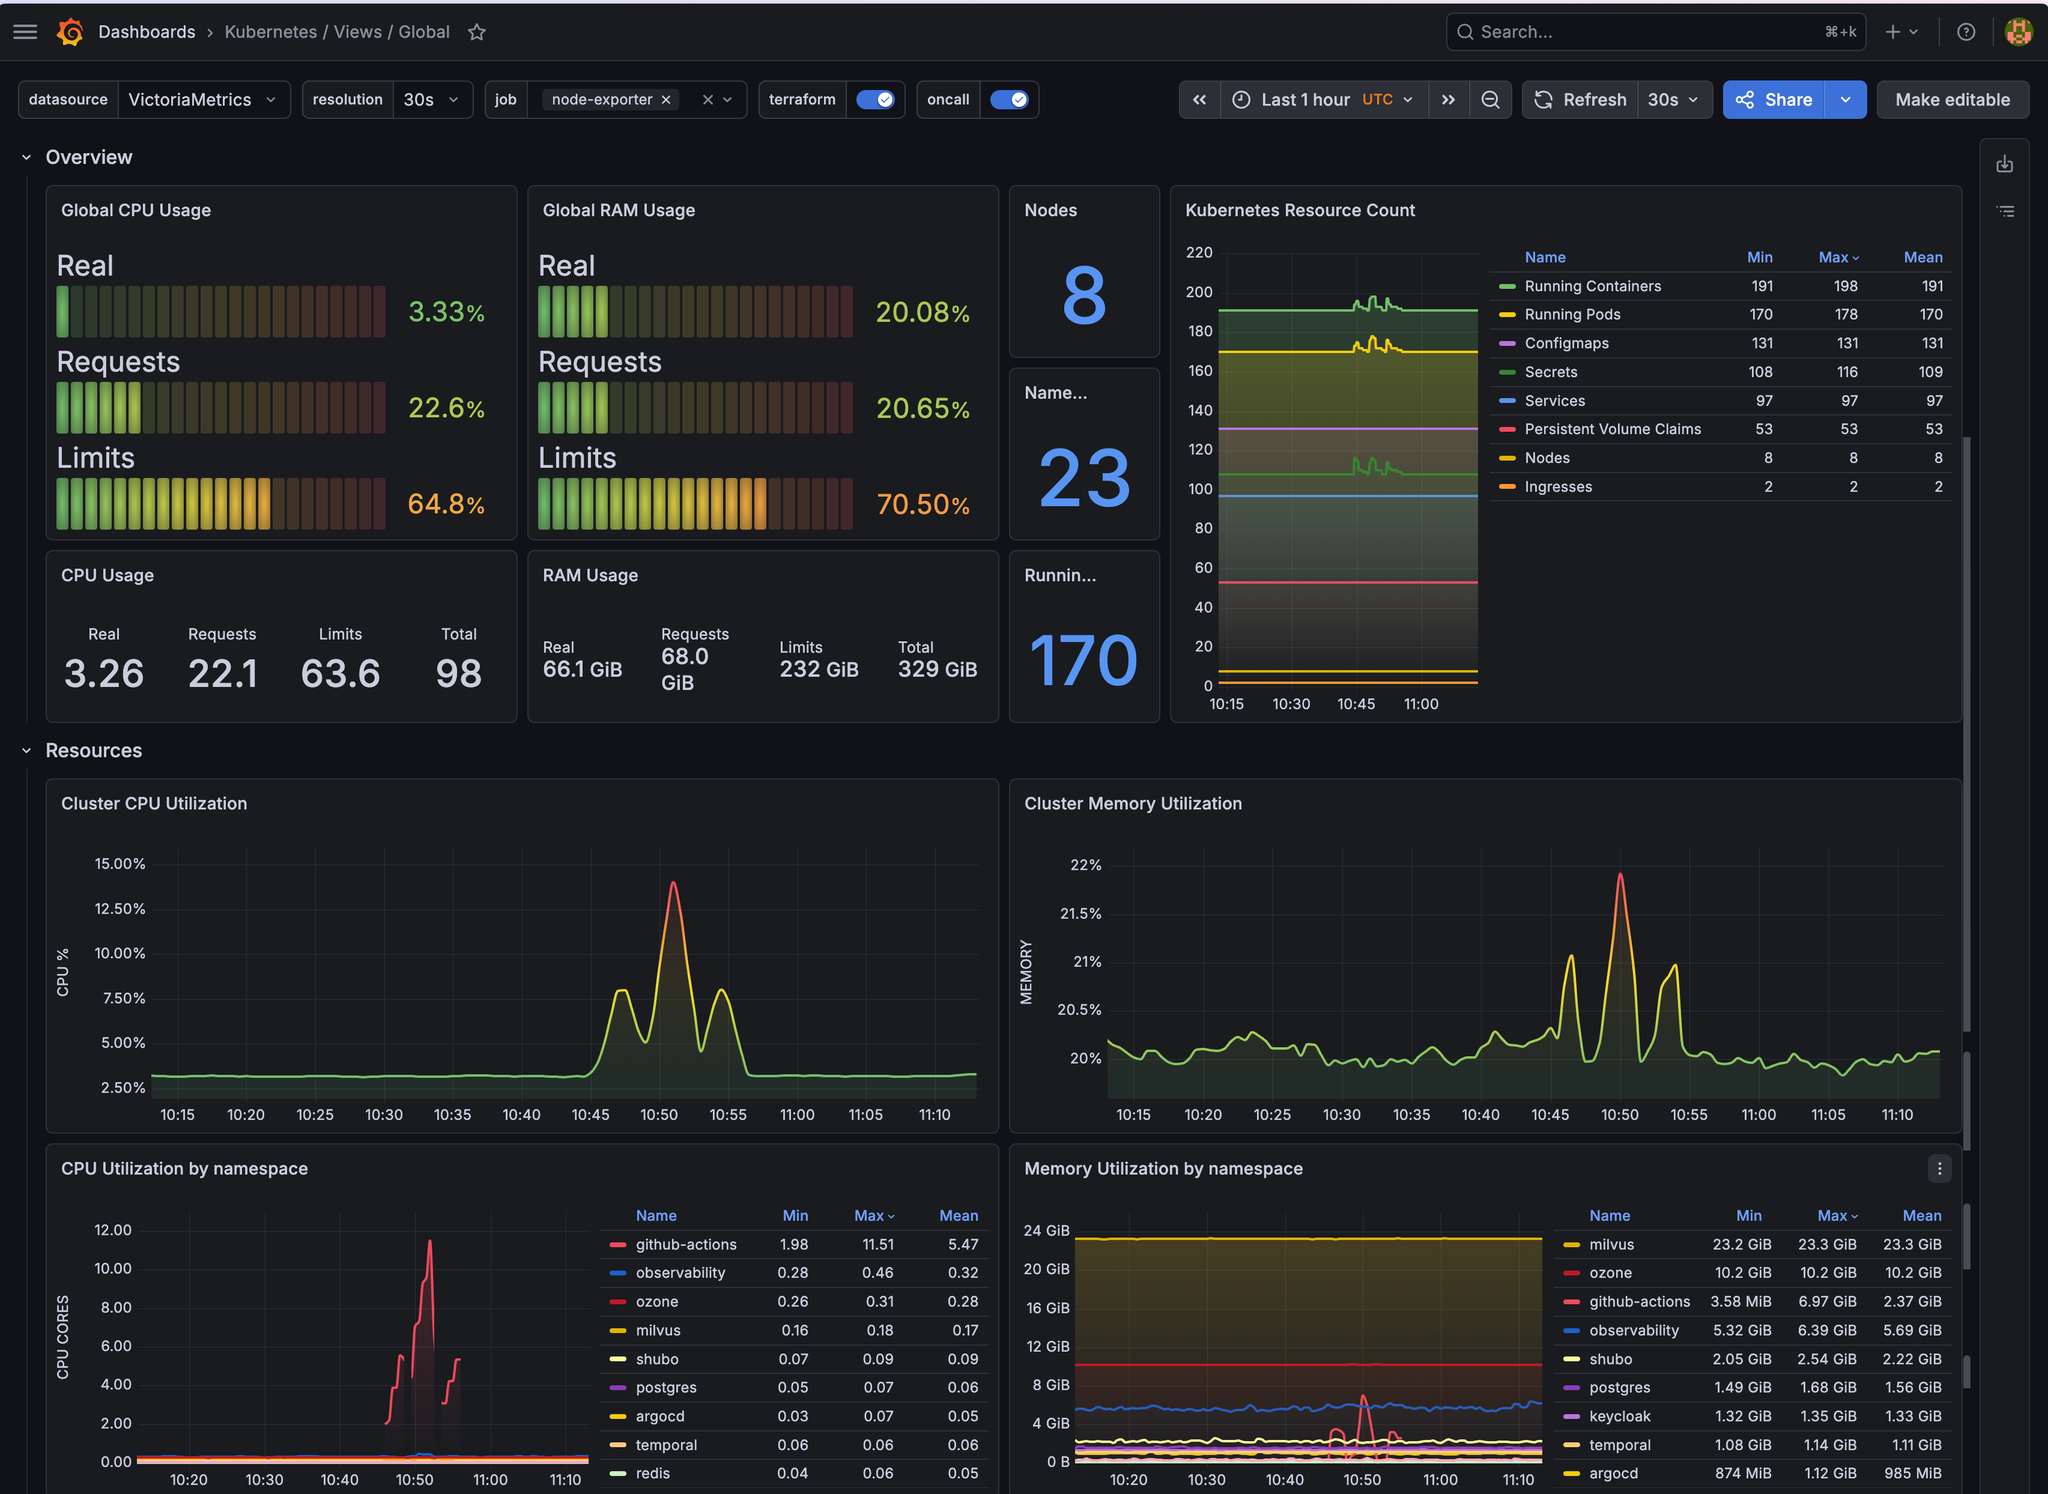
We replaced ours with a handful of panels that filter to the series with actual traffic (Fig. 3). The rule we settled on: a panel earns its place by changing somebody’s next action. Everything else is furniture, and furniture on a dashboard is worse than absence, because absence is honest.
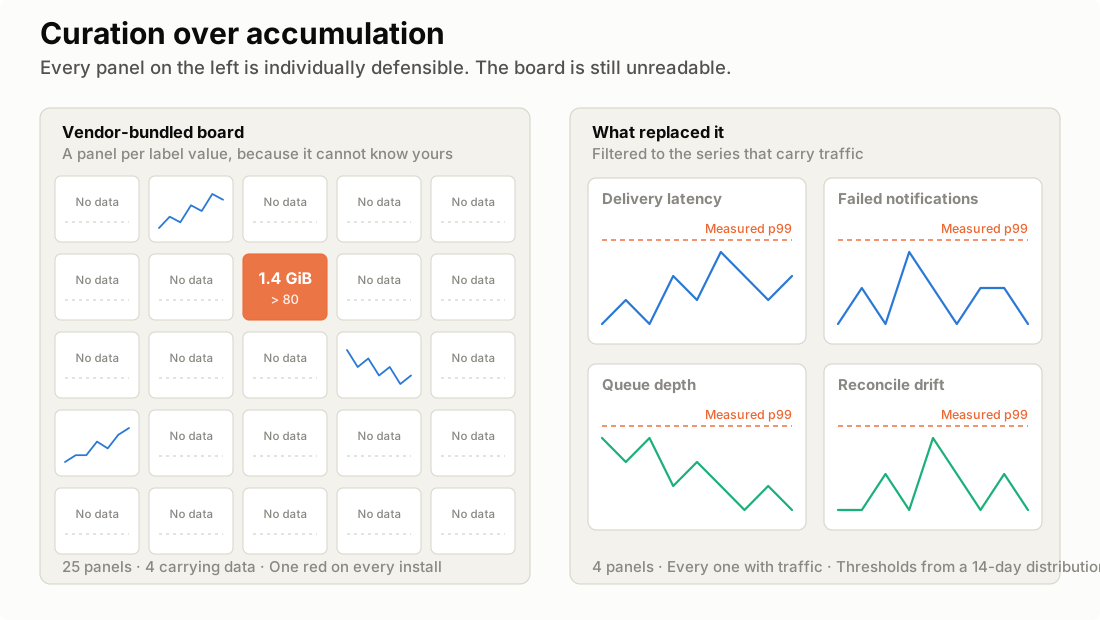
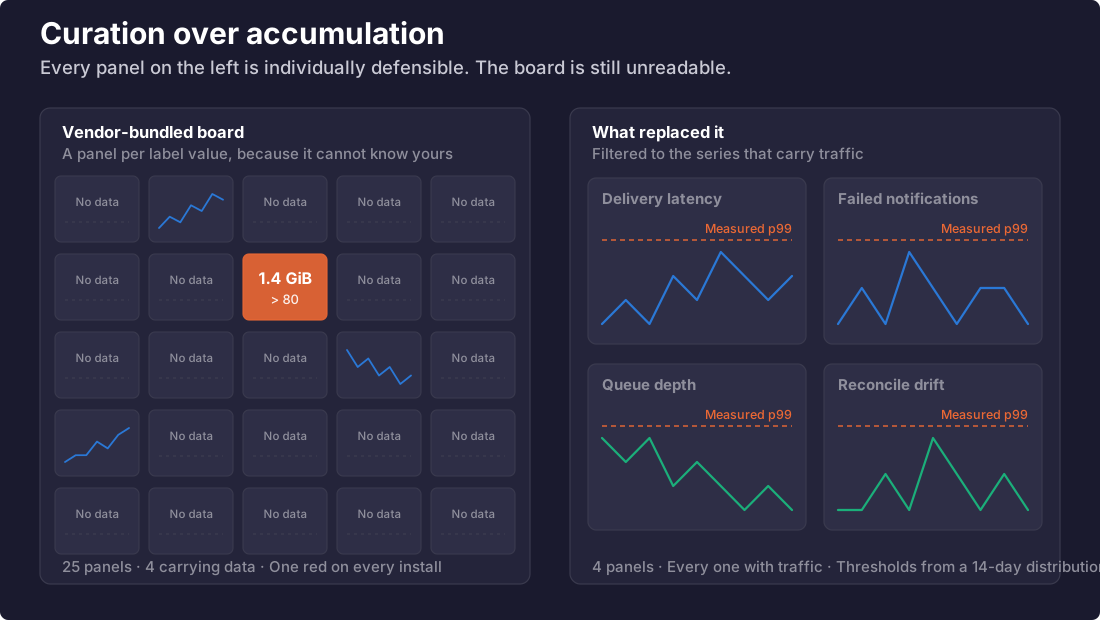
Thresholds get the same treatment. Every threshold on our boards and in our alert rules comes from a measured distribution — the actual multi-day maximum or percentile of the thing being watched — never a vendor default and never a number that sounded round. This is not fussiness. Grafana’s stock stat-panel threshold is red above 80, applied to the raw value regardless of unit, which paints any panel measuring bytes or seconds permanently red the moment it exceeds eighty of them. A dashboard that is always red is a dashboard nobody reads, and you have then achieved negative observability: the display actively trains its audience to ignore it.
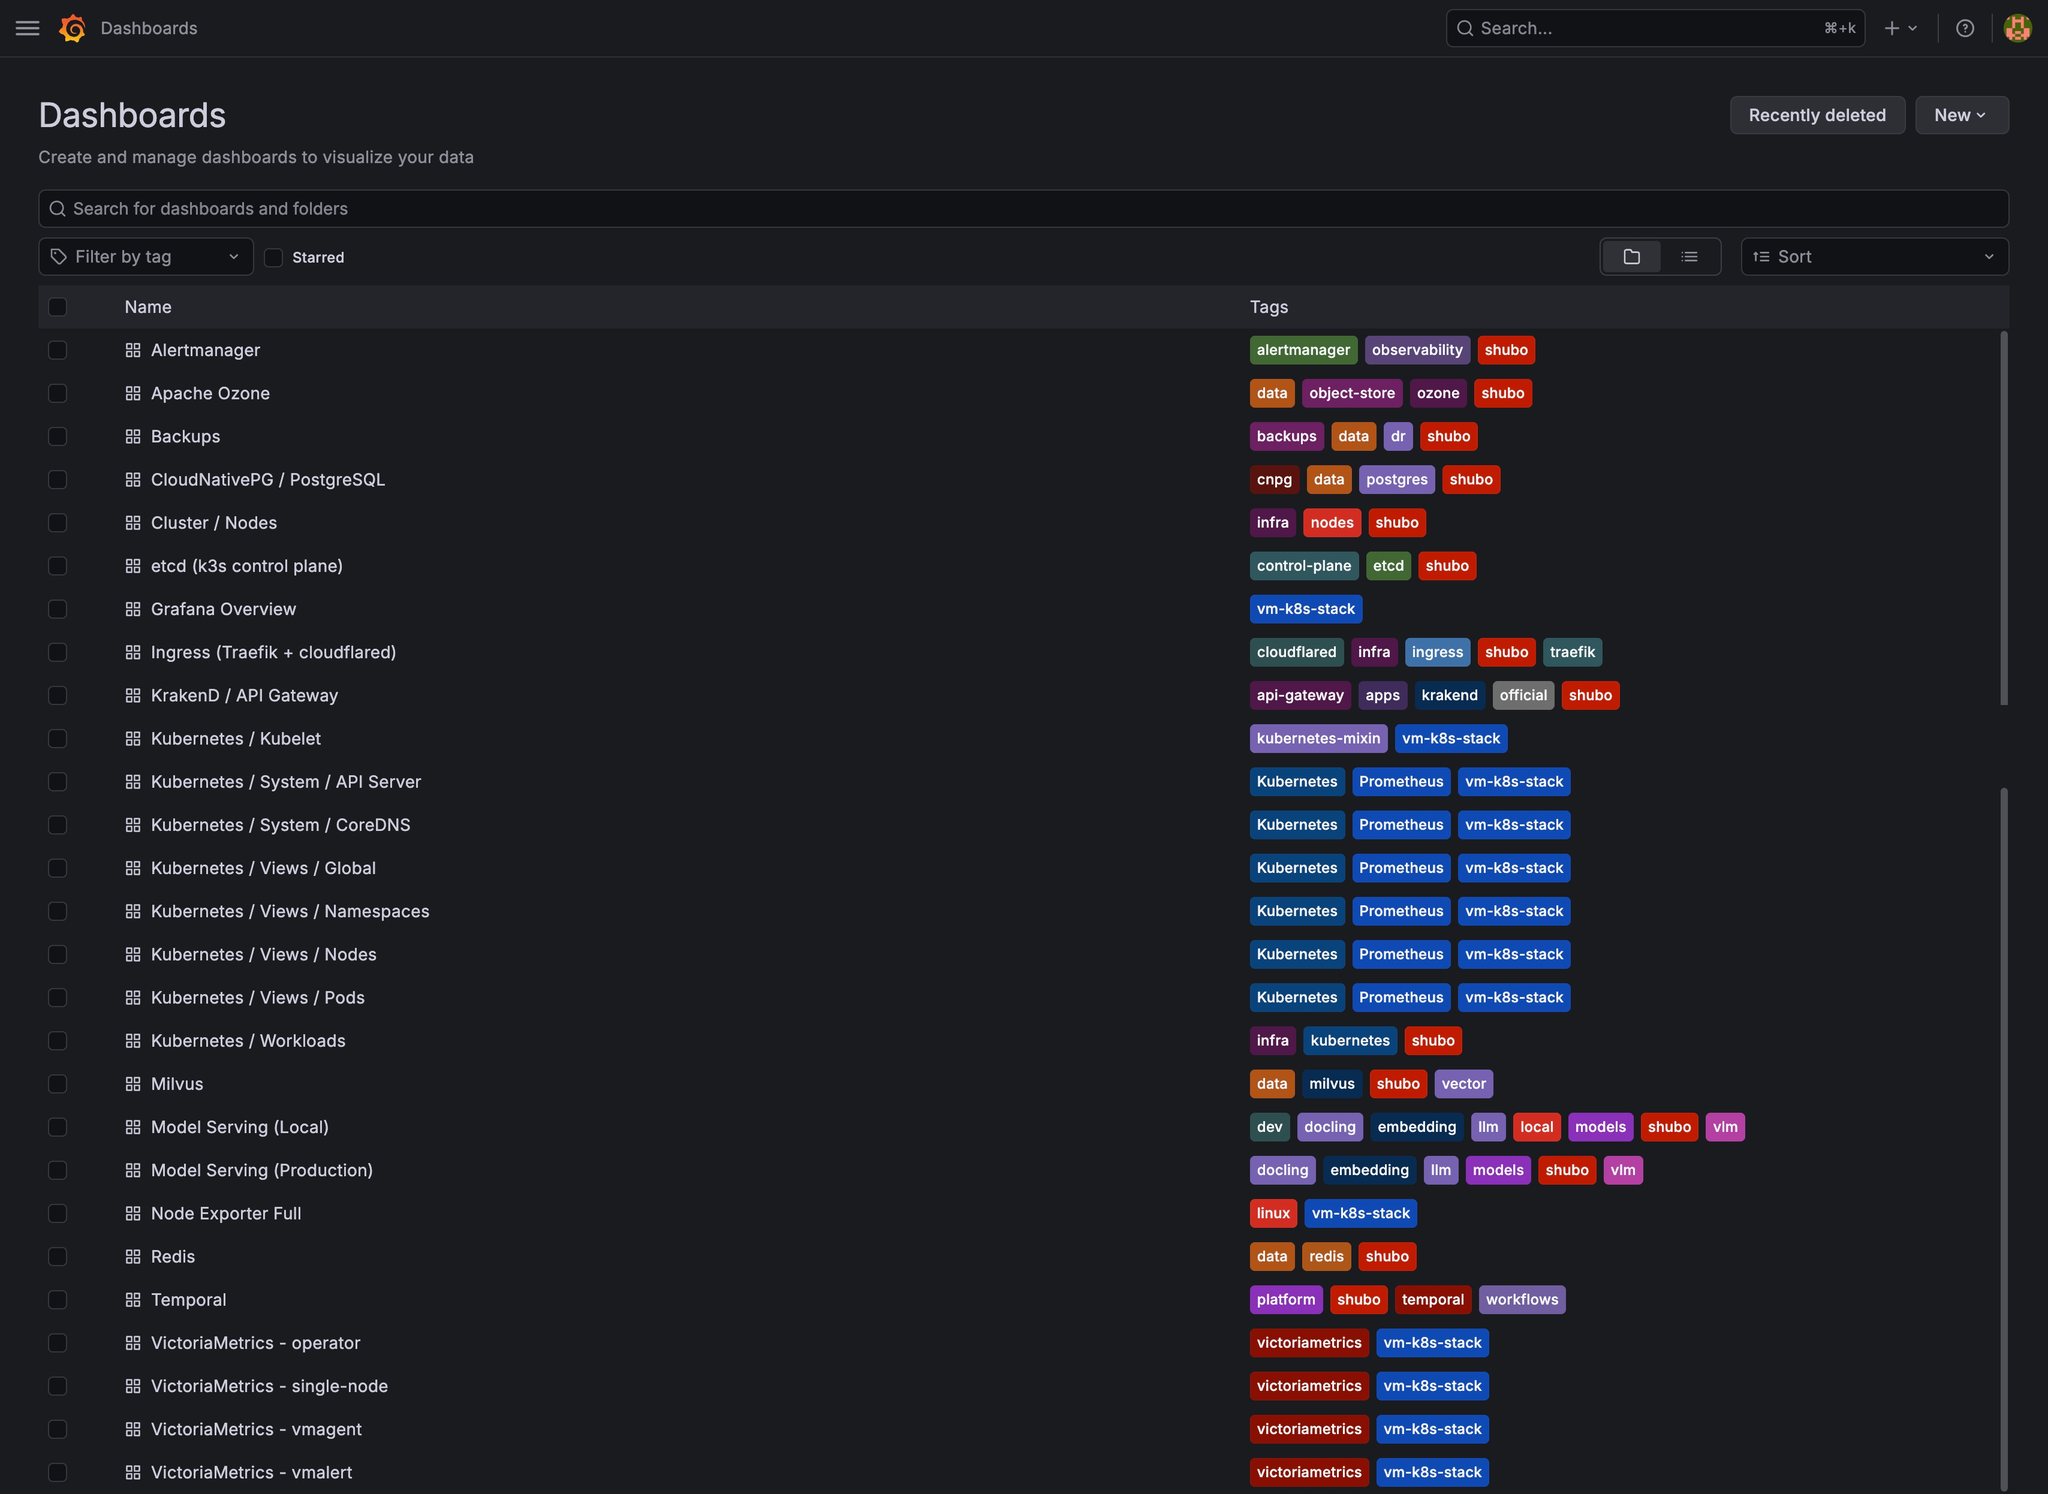
What survives that discipline is small (Fig. 4): a shelf of boards, one per concern, and panels that are only there because somebody reads them.
Nothing is trusted until it has failed
This section is one rule applied twice. A signal you have never seen fire and a check you have never seen fail are the same object: an assertion of optimism. The first half is about the metrics that lie; the second is the drill that makes every check prove it can go red.
Detection, and the metrics that lie
Alerts split by severity into two channels: one that wakes a human, one the agent watches continuously. That split is the entire reason a human can stop watching. It is not that fewer things go wrong; it is that the class of things which merely need doing has a competent recipient that is not a person. (Fig. 8, below, is five minutes of that second channel at work.)
Every rule carries a runbook URL, so detection and response ship together. An alert that tells you something is broken without telling you what to do about it has externalized its hardest part onto whoever is holding the pager at 3am.
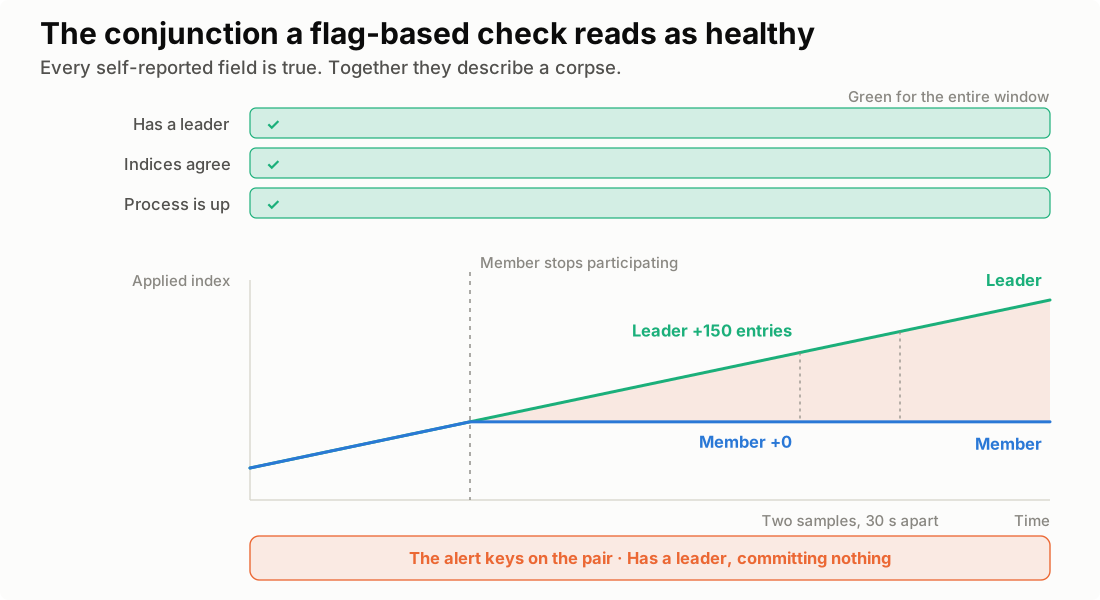
The harder lesson is about which metrics to trust. Health flags lie under exactly the conditions you built them for. A component that has become detached from its peers will frequently continue to report that it has a leader, that its internal indices agree, and that its process is up — every one of those true in isolation, and the conjunction of them still describing something doing nothing at all. The self-consistency is the trap: the component is internally coherent and externally dead.
The signal that exposes it is comparative rather than local: progress measured against a peer’s (Fig. 5). When you write detection for anything with consensus or replication in it, assume every self-reported health field is a claim by an unreliable narrator, and find the quantity that requires two parties to agree. Replication lag, applied-index deltas, and consumer-group offsets are all this shape. A single number reported by the sick component about itself is not.
Verification, and making a check fail on purpose
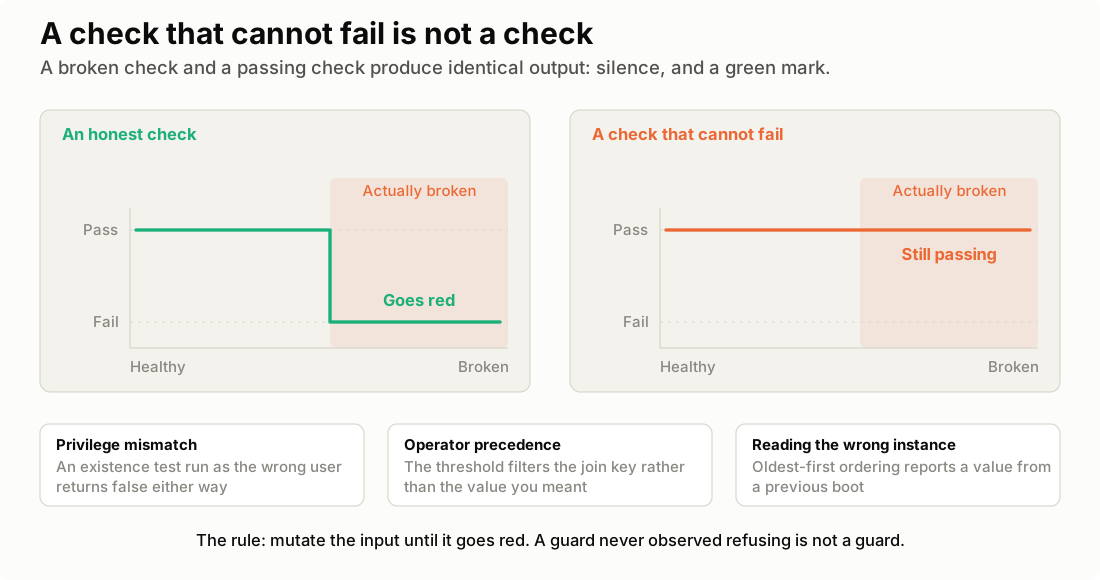
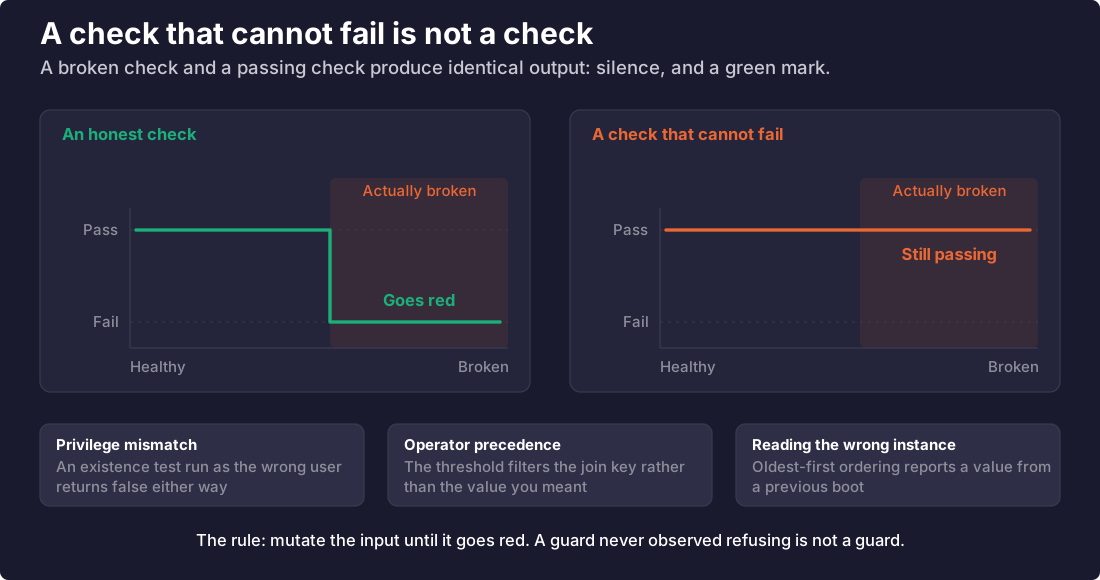
Automation is trustworthy in proportion to the honesty of its verification, and verification fails in ways that are almost invisible, because a broken check and a passing check produce identical output: silence, and a green mark.
Three ways I have watched a check quietly lie, none of them exotic:
Privilege mismatch. A test that runs with different credentials than the operation it guards is answering a different question. A directory existence test executed as an unprivileged user against a root-only path returns false whether or not the directory exists — so a script gated on it skips its own work and reports there was nothing to do. The fix is trivial: run the check at the privilege of the action. The failure mode is not, because it is silent and it reads as success.
Operator precedence. In PromQL, comparison binds more tightly than set operations, so a threshold written after a join filters the join key rather than the value you meant. Both forms parse. Both look correct in review. One of them fires forever.
Reading the wrong instance. Log queries return oldest-first by default, so a naive “first match” reads the earliest record rather than the latest, and cheerfully reports a value from a previous boot. This one is especially cruel because it stays invisible while the values agree — which is exactly until you change something and need the check to notice.
The unifying property is that none of these could have failed (Fig. 6). Each returns the same comfortable answer under every condition, including the conditions it existed to detect. So the practice we adopted is to make the check fail on purpose before trusting it: mutate the input, move the threshold, point it at a known-bad state, and confirm it goes red. A guard never observed refusing is not a guard, it is decoration.
And confirm the effect, not the action. Having run a command is not evidence the command worked — the two diverge precisely when something else has gone wrong, which is the only time it matters.
Automatic fix, in three layers
“Self-healing” is usually a marketing word. Concretely it has three tiers, in descending order of how much they are worth (Fig. 7).
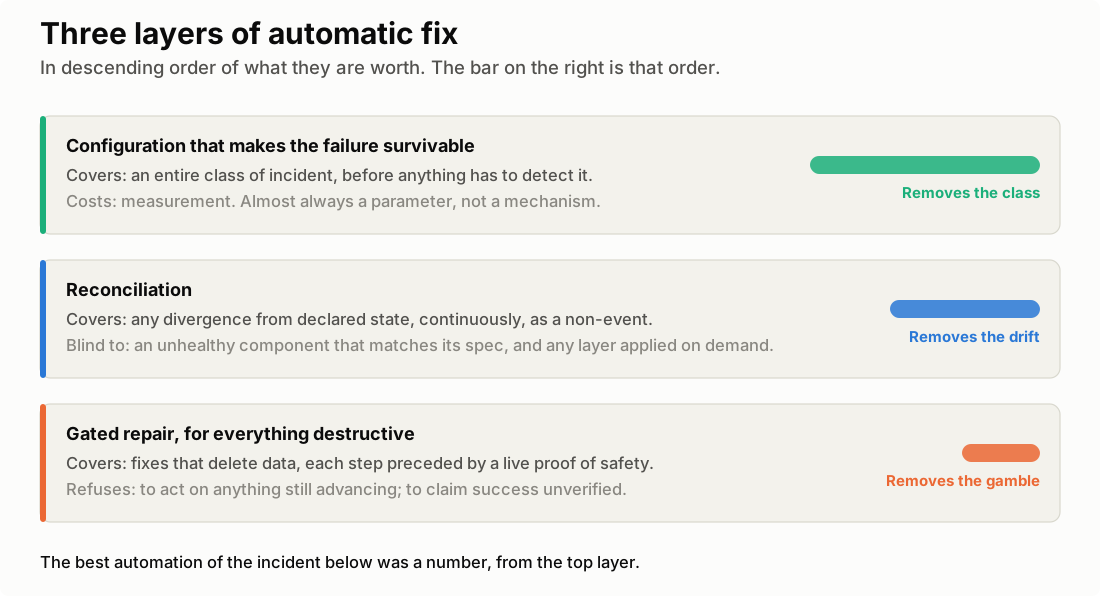
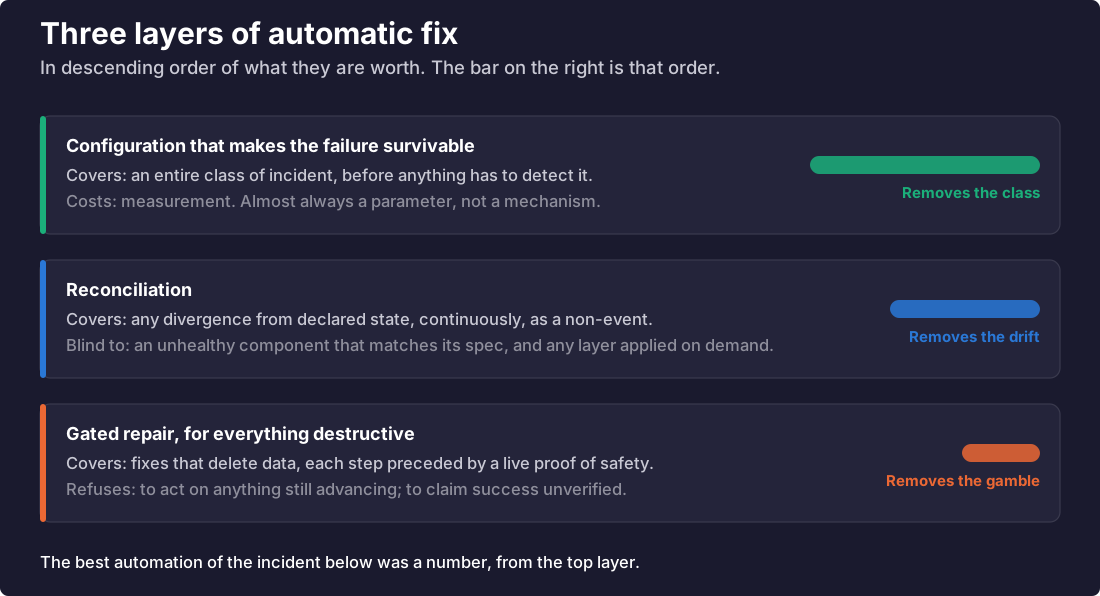
Configuration that makes the failure survivable. The highest-value fix removes a class of incident from the pager entirely, and it is almost always a parameter rather than a mechanism. Distributed systems ship defaults tuned for the environments their authors had, and a default that is generous in one environment can be marginal in yours. The gap between “recovers by itself” and “requires a human to intervene” frequently sits on one side or the other of a single number. Finding those numbers is unglamorous: you measure your actual throughput, compute what the default tolerates in units of your system’s time, and discover the margin is minutes when you assumed it was hours. Nothing about that work looks like automation. It eliminates more pages than any automation we have written.
Reconciliation. Continuous restoration of declared state converts an entire category of drift into a non-event. This is the layer people usually mean by GitOps, and it is genuinely load-bearing, but it only repairs divergence from a spec — it cannot help a component that is unhealthy while matching its spec perfectly. It also only covers what it continuously watches, which is less than the repository contains; the next section is about the rest.
Gated repair, for everything destructive. When a fix requires deleting data, the agent does not improvise against production. It generates a script whose every destructive step is preceded by a live proof that the system survives it — not a health flag, but an actual write executed through a different replica, demonstrating that the cluster still accepts work without the component about to be removed. The script refuses to continue if that write fails. It refuses to act on something still making progress. And it will not report success until it has re-read the effect it was supposed to produce.
That last property is the one I would keep if I could keep only one.
Fig. 8 is the middle tier caught on the record, which is rare, because its successes are non-events. A node dropped out and took its metrics collector with it. The platform restarted the collector the moment the node returned, so the warning that landed in the agent’s channel at 18:20 resolved beside itself at 18:25 — repaired before anyone could have acted on it. A worse arrangement pages a person at 18:20 so they can watch the system fix itself by 18:25.
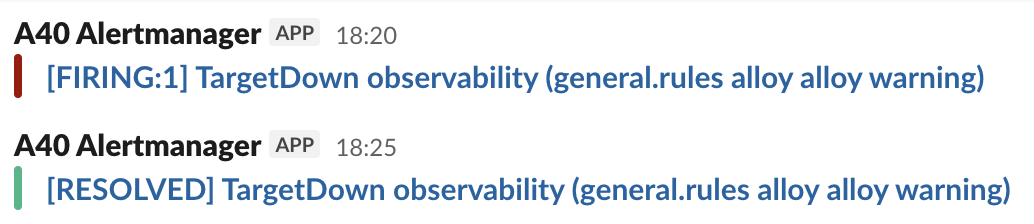
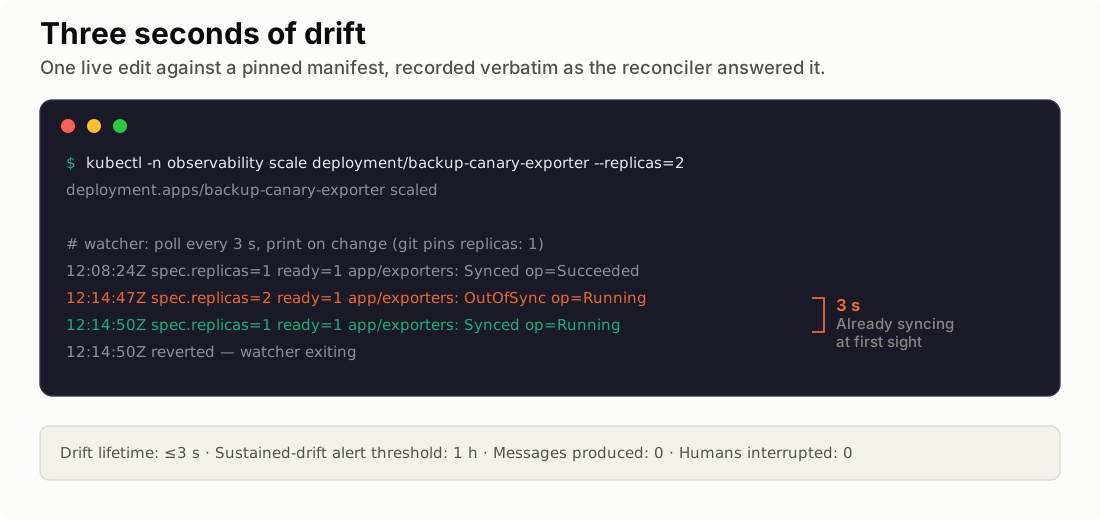
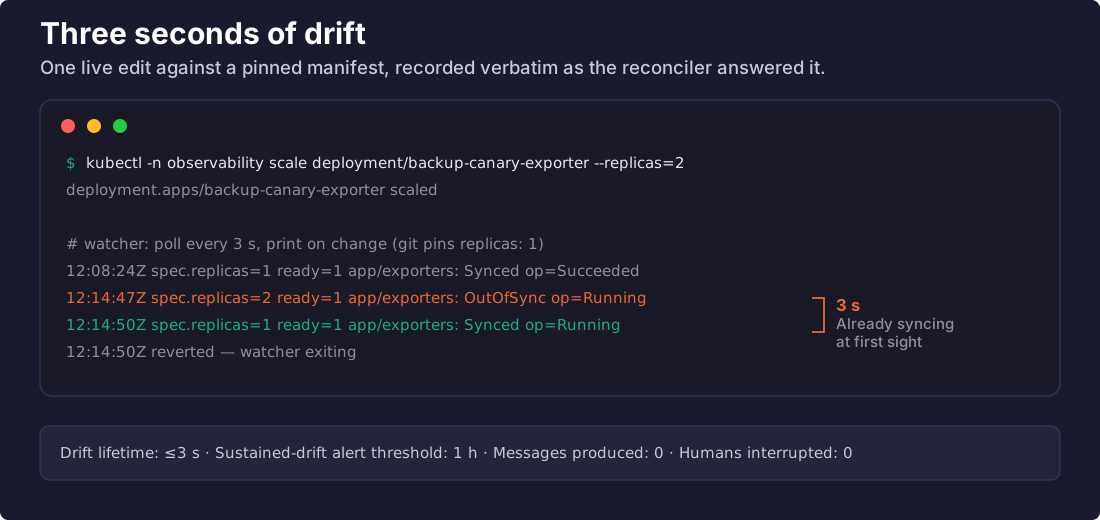
To be precise about who repaired that: Kubernetes’s own reconciliation — a kubelet re-running a container the node’s spec says should exist — not the GitOps repository’s. The tier is bigger than the buzzword. The GitOps flavor is quieter still, so to photograph it I had to stage its trigger — the same drill this post applies to every mechanism: make it show its behavior on purpose. I scaled an exporter from one replica to two by hand, exactly the out-of-band edit the loop forbids, against a manifest that pins one. Fig. 9 is the transcript: at the first poll that saw my edit, the reconciler was already syncing, and by the next poll — three seconds later — the count was back where the repository said it should be. No alert, no message, and an extra pod that was gone before it ever became ready. That is the middle tier’s entire working day, compressed to where you can watch it.
The layer no reconciler watches
A reconciler watches what lives inside the cluster. The DNS records, the repositories these changes travel through, the object storage the backups land in, the cloud projects underneath them — that layer is Terraform, and Terraform is not a reconciler. It converges when you run it, and between runs it holds no opinion at all. So drift here is silent (Fig. 10): somebody edits something in a console, a provider moves a default, and the repository is fiction while every dashboard stays green — until the next apply arrives, carrying a change nobody wrote alongside the one they did.
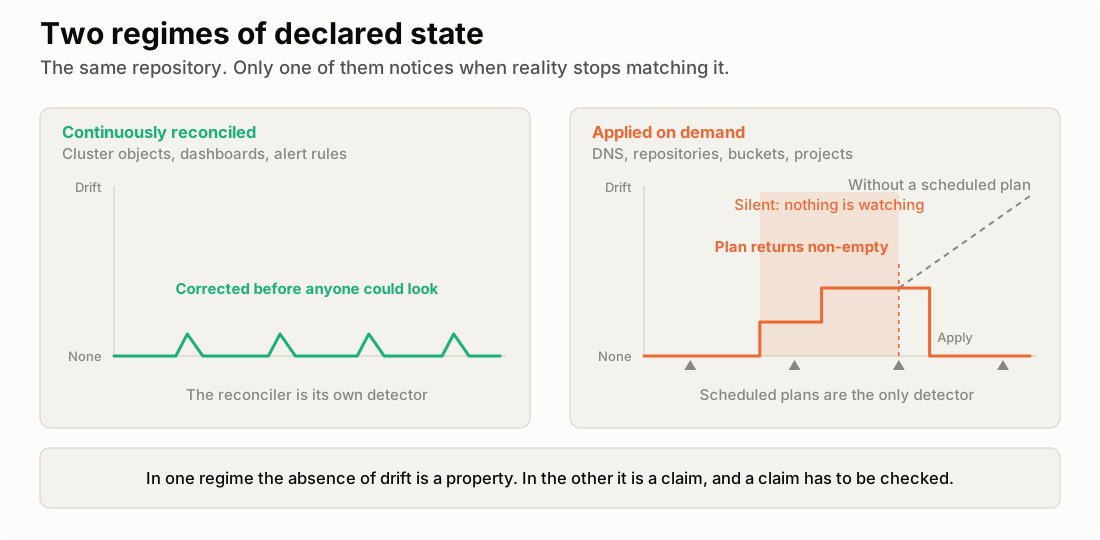
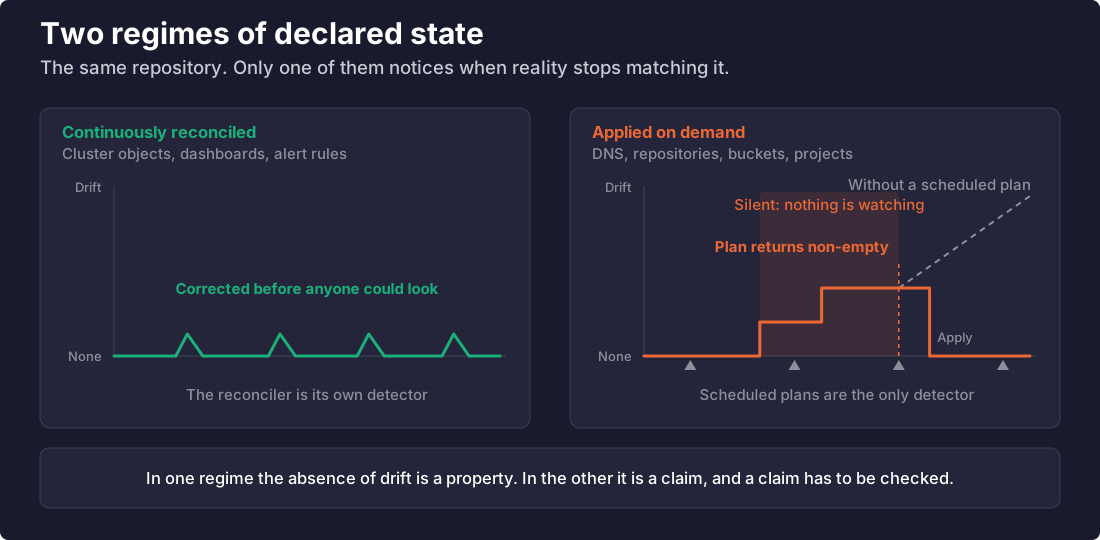
The treatment is the same as everywhere else in this post: the absence of drift has to be established rather than assumed. A plan runs against every root module on a schedule, and a non-empty result raises an alert like any other signal. The absence of any result at all raises another, because a quietly disabled workflow and a fleet with nothing wrong otherwise produce identical output — silence — and silence reads as health.
The drift alert itself was first written the obvious way — fire when the metric reports drift — and it could never fire: a result lands every six hours, the metric store only looks back five minutes, so the rule spent the gap between results evaluating against nothing, while looking exactly like coverage. What caught it was forcing it to go red before trusting it — the drill from the verification section above.
Everything else follows the loop unchanged. Changes arrive as pull requests, CI posts the plan back onto the pull request — the diff a human reads is
the plan, which says what will happen rather than what you wrote — and apply runs from CI on merge, with credentials the agent does not hold. Two
guardrails are specific to this layer: prevent_destroy on anything stateful, because a plan that replaces a database is the same category of event
as a script that deletes a data directory, and the state file in a versioned remote store, because losing it leaves the infrastructure standing while
nothing remains that can describe it.
The system writes its own reports
Once a day, a read-only routine produces a posture digest and lands it as a pull request: tier by tier, each claim carrying the metric behind it, with CI posting the summary into the incident channel (Fig. 11). A human merges it to keep the history, or closes it.
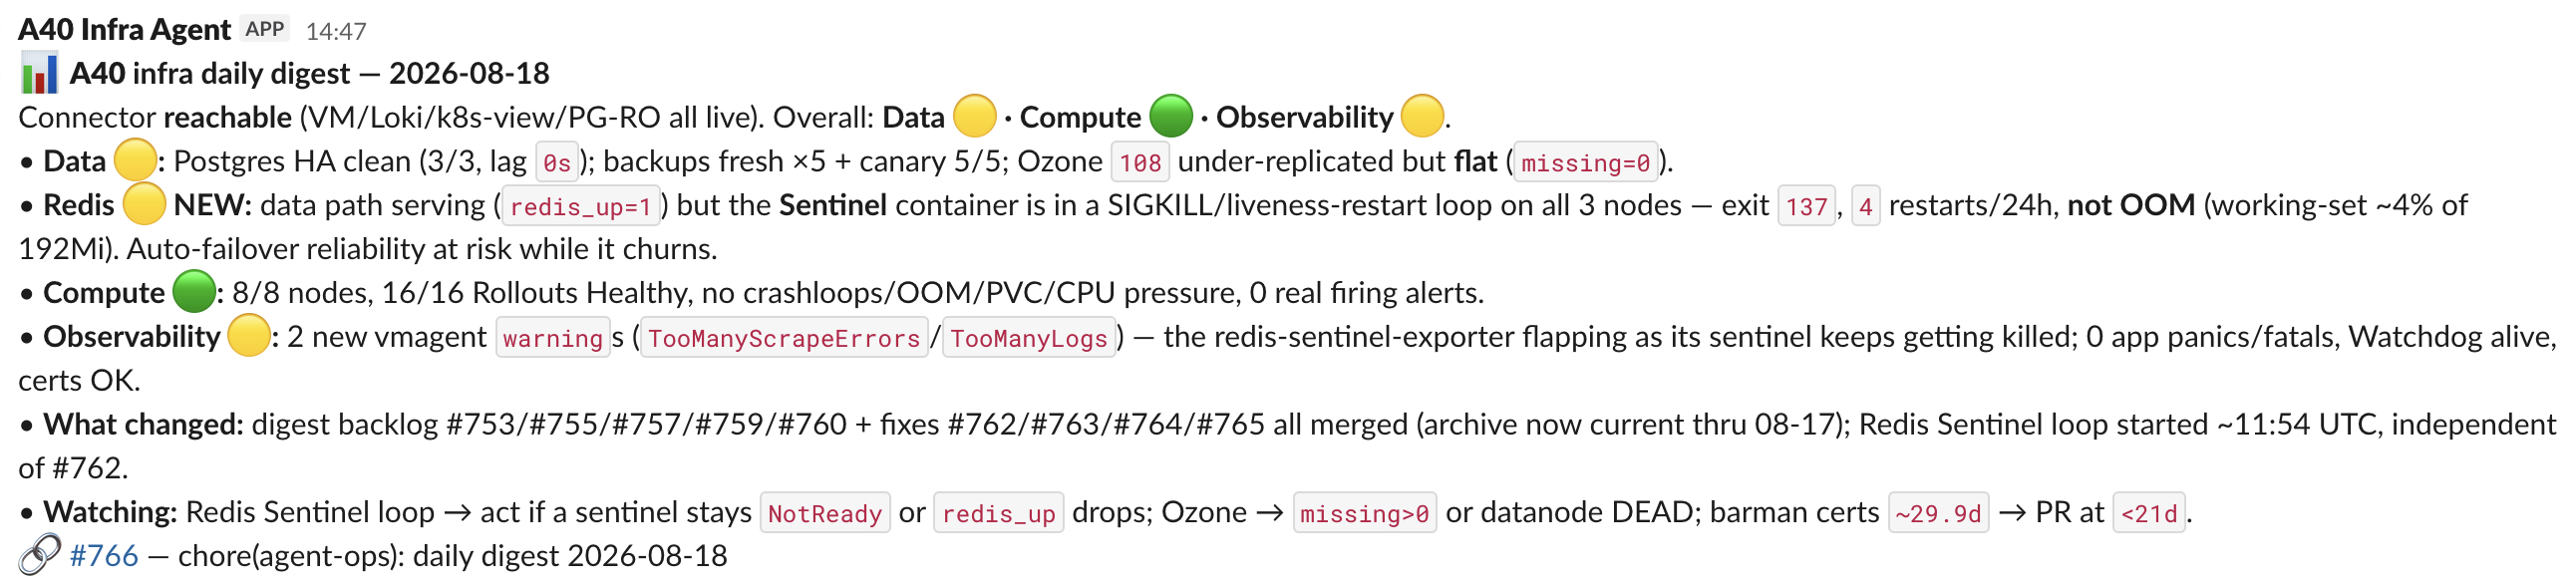
Two properties make it worth reading rather than skimming.
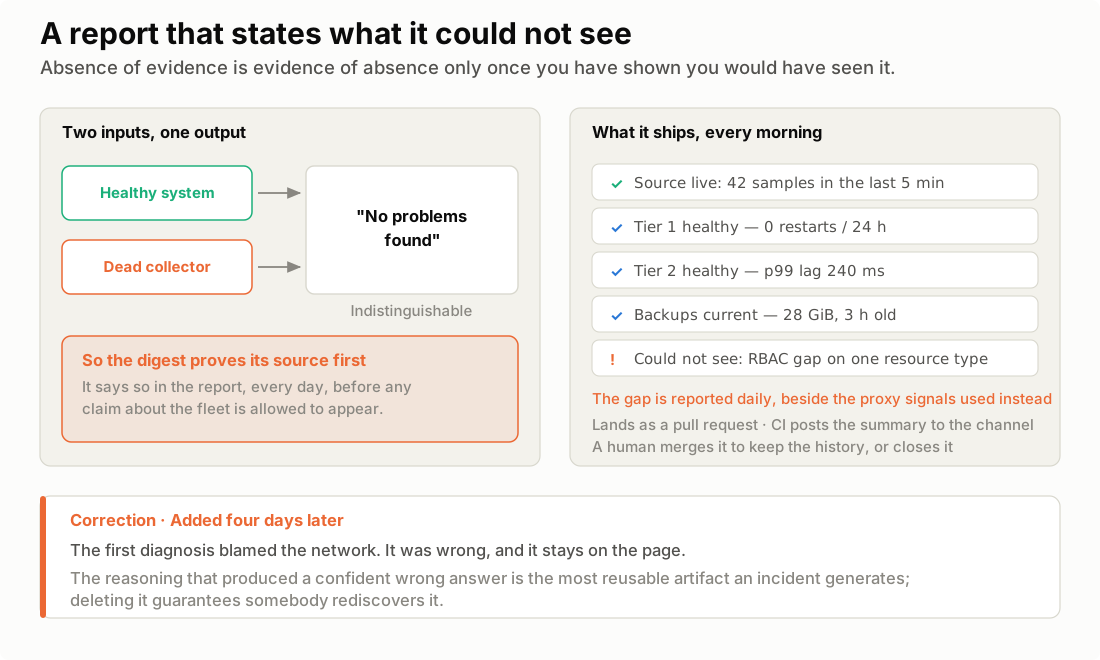
It validates its own pipeline before reporting (Fig. 12). A monitoring report drawn from a dead collector looks identical to one drawn from a healthy system — both say “no problems found.” So the digest first establishes that its data source is live and states that it did so. Absence of evidence is only evidence of absence once you have shown you would have seen it.
And it names what it could not see. One read-only service account is short a permission for one resource type; rather than silently omitting that section, the digest reports the gap every single day, alongside the proxy signals it used instead. A report that quietly drops the checks it could not perform is worse than no report, because it manufactures confidence out of a blind spot.
Incidents become postmortems in the same repository, as runbooks the alerts link to. When later evidence contradicts one — and it does, because early diagnoses are frequently wrong — it gets a correction banner rather than a quiet edit. The wrong conclusion stays visible beside the right one. That is not sentimentality about history: the reasoning that produced a confident wrong answer is the most reusable artifact an incident generates, and deleting it guarantees a rediscovery.
The substrate is interchangeable
Everything above is portable. This section is the part that is not, and it is short on purpose.
Our cluster is self-managed on hardware we own, joined by a zero-trust mesh rather than a cloud network, with the only public entry point an outbound tunnel — so there are no inbound ports and no public address to scan. Internal surfaces are reachable only over the mesh, through tag-scoped authorization rather than network membership. Backups leave the same way, off-host to object storage.
If you run GKE, EKS, or AKS you get most of those properties differently and with less work: private clusters, managed ingress, IAM, service controls. The properties are what matter — no listening surface, authorization that is not membership, state that survives the cluster — not the components that provide them (Fig. 13).
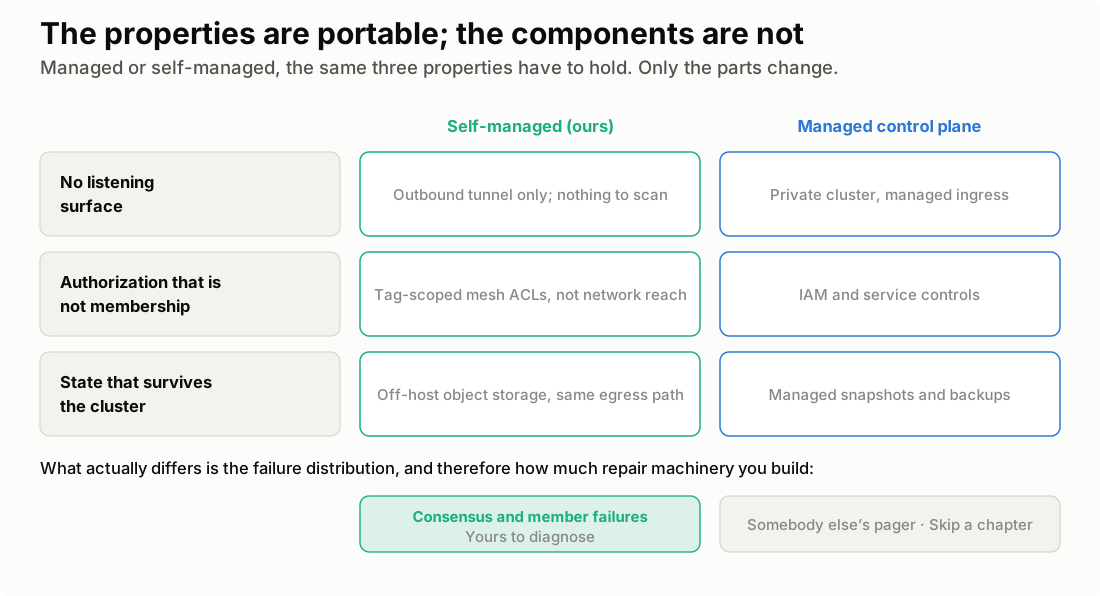
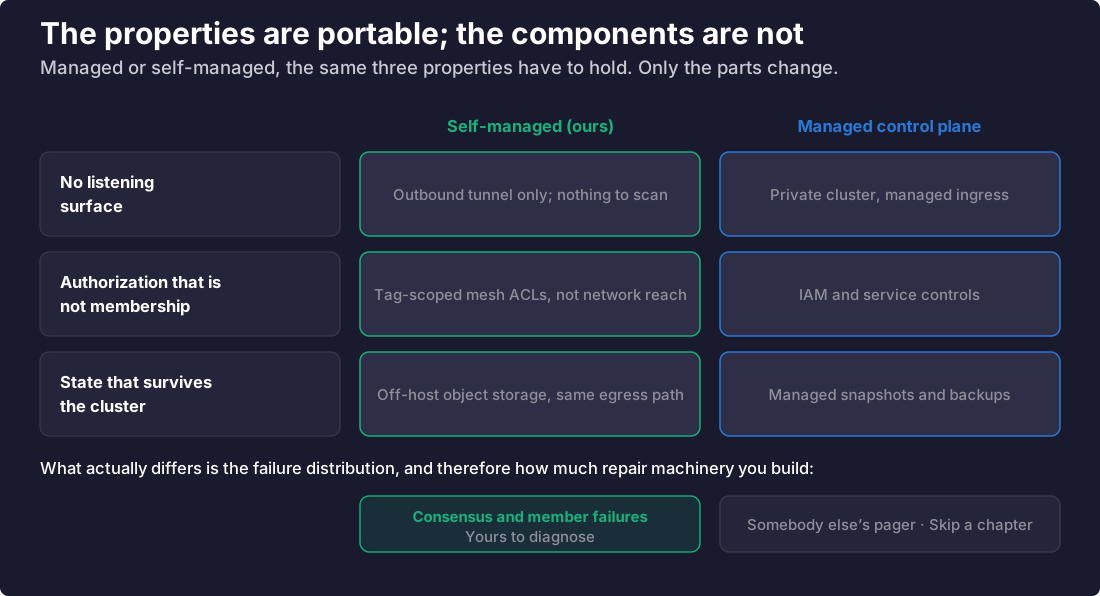
What genuinely changes is the failure distribution, and therefore how much repair machinery you need. A managed control plane makes an entire class of incident somebody else’s pager. Ours does not, which is why the consensus-member failure below was mine to diagnose. That difference decides how much of the gated-repair layer you build — not whether the loop, the curation discipline, or the verification rule apply. Those hold anywhere; the managed case simply gets to skip a chapter.
One incident, end to end
Abstractions are cheap. Here is one failure that exercised every layer above, including the part where my own tooling lied to me.
The symptom. Over two weeks, a replicated stateful component stopped participating five times. The process stayed up, the metrics endpoint kept answering, and the member did nothing. Each time, the fix was a hand rebuild — turning it off and on again, with extra steps and no explanation.
The detection. Every health flag was green: the member had a leader, its internal indices agreed, it was up and being scraped. All true, and together they described a corpse. What finally exposed it was the one signal that requires two parties: progress compared against the leader’s. Sampled thirty seconds apart, the leader advanced about 150 entries; the member advanced zero. That comparison is now the alert — has a leader, committing nothing — exactly the pair a flag-based check reads as healthy.
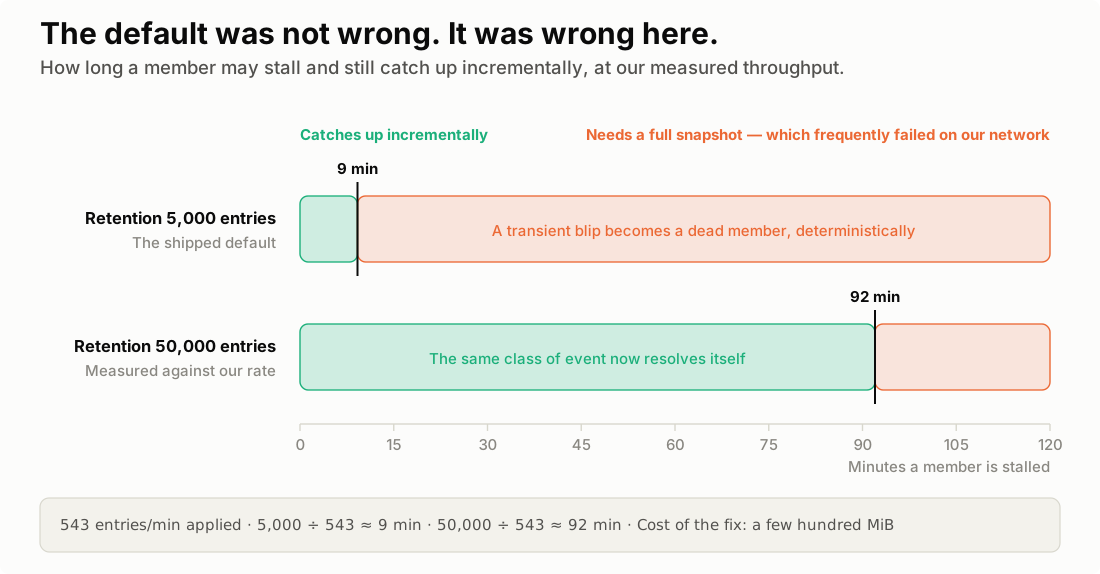
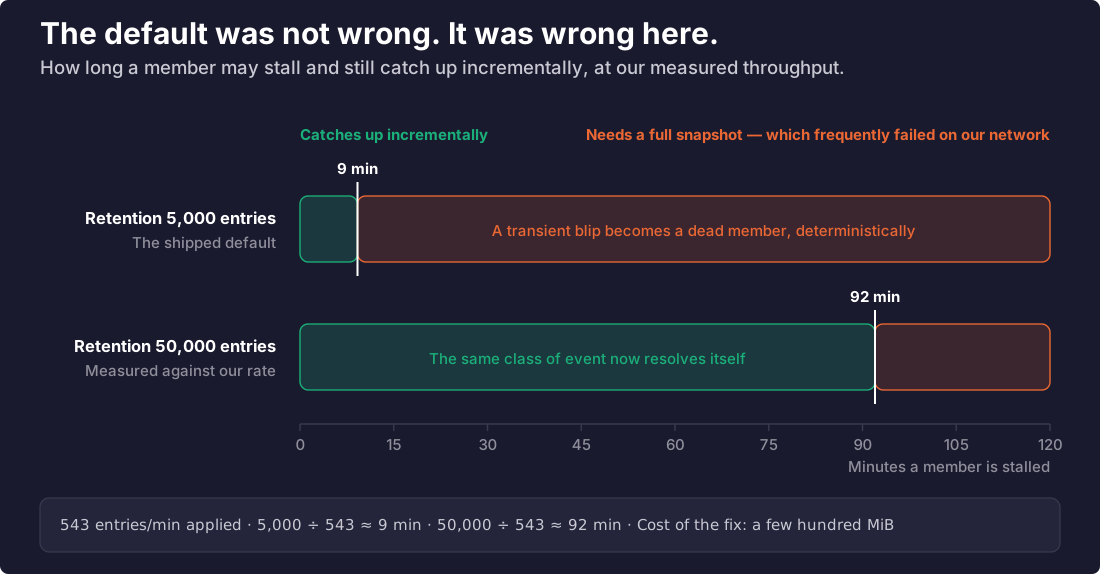
The cause. A default, not a bug. The system keeps 5,000 log entries so a lagging member can catch up incrementally; fall further behind and it needs a full snapshot instead, and snapshot transfers frequently failed on our network. At our measured 543 entries per minute, 5,000 entries is nine minutes. Any stall longer than that killed the member, deterministically.
The fix. Raising retention to 50,000 moved the cliff from nine minutes to roughly ninety (Fig. 14), at a cost of a few hundred megabytes. The same class of event has resolved itself ever since. The best automation we wrote that fortnight was a number — and it is in no documentation, because the default is only wrong here, and only measurement makes that visible.
The shape outlives the component. On a managed control plane you will never touch this particular system, but every replicated stateful thing you run has the same failure mode — a database replica, a broker, a queue consumer. Internally consistent, externally dead, and reporting healthy is a category, not an incident.
The repair, gated. A rebuild, where one is still needed, deletes state on a consensus member — irreversible. So nobody does it by hand: it runs as a rebuild script of exactly the gated kind the fix section describes, proving safety before each destructive step. It executes a real write through a healthy peer and refuses to continue unless it succeeds. It also refuses to touch a member whose progress is still advancing. That second gate has stopped me twice: I was sure the member was dead, the script declined, and the member recovered on its own a few minutes later.
The lie. The first version of that rebuild script was written carefully: check that the dead member’s data directory exists, delete it, check again to confirm it is gone. What it got wrong was who asks. The directory sits behind a parent only root can enter, and the script ran its checks as my ordinary login user — and to a user who cannot enter the parent, a path that exists and a path that does not look identical. Both answer “not there.” So the guard decided there was nothing to wipe, the delete never ran, and the confirmation — the same question, asked with the same missing privilege — certified a wipe that had not happened. Green checkmarks over an untouched directory, and a member rebuilt on top of the very state it was supposed to shed, broken for another twenty-five minutes while I believed the output.
The script was not wrong about what to do; it was wrong about whether it had done it, and nothing it printed could tell those two apart. That is the verification section in one story.
What it costs
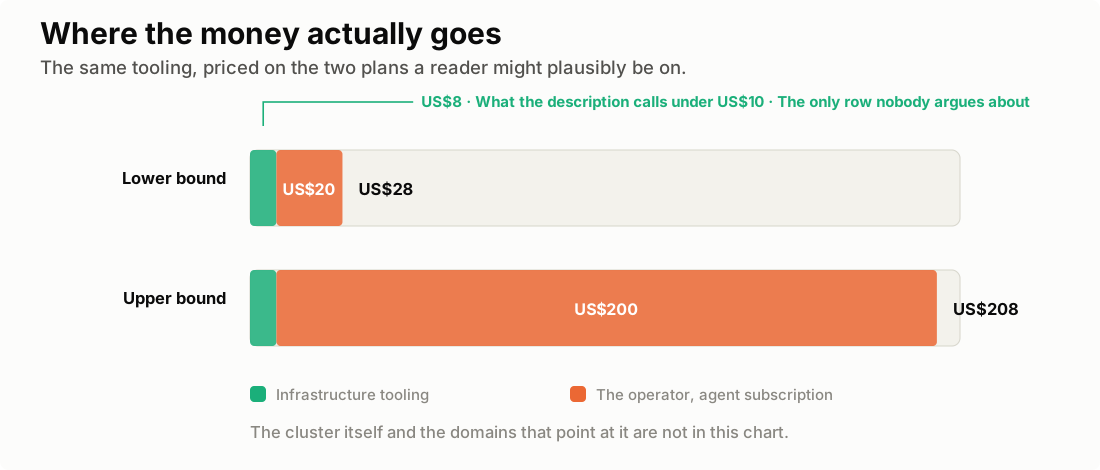
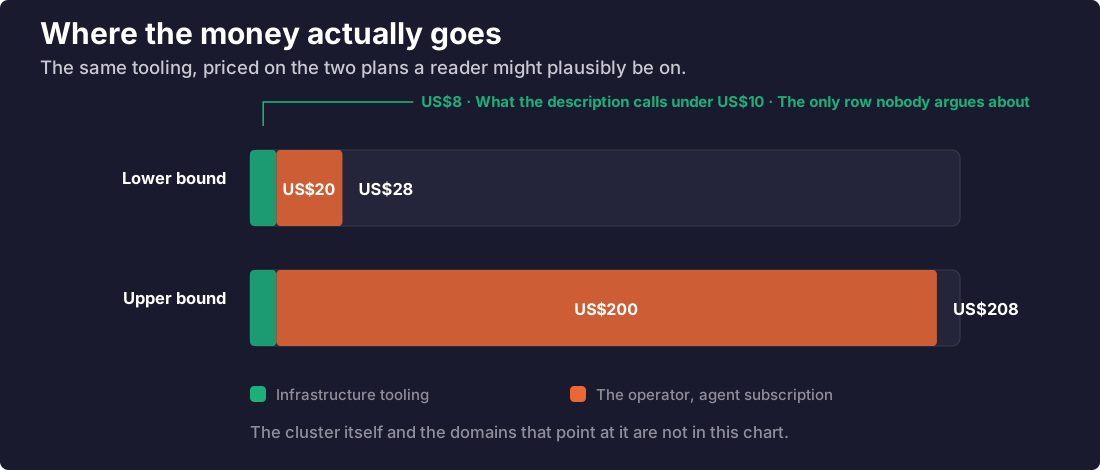
The metered services are very nearly free, and I mean that arithmetically rather than rhetorically. All backups together — database base backups and write-ahead log, control-plane snapshots, secrets, object and vector store dumps — total about 28 GiB, which after the free tier bills at roughly US$0.30 a month. The tunnel is free. The mesh is free at our size: twenty-five devices, but only two human accounts, and the free tier covers three. CI runs on our own hardware, so the minutes cost nothing, and the metric and log stores sit on the same machines — retention for both is a disk decision rather than an invoice. Call the cloud bill US$1 a month, most of which is rounding.
Stated alone that would be dishonest, because one cost sits outside it and exceeds everything above combined. The operator is not free: the agent doing this work is a paid subscription and is comfortably the largest single line item. There is a version of this post that omits that to make the economics look sharper. It would be the wrong post — the agent is not an accessory to the stack, it is what makes an unmanaged fleet tractable for two people, and its cost belongs in the total.
What none of these figures include is the cluster itself, or the domains that point at it. The machines would be drawing power and the names would renew whether or not any of this ran, so both are the cost of having the thing rather than of running it like this, and they sit outside every number here.
Itemized at list price, so the headline number has nowhere to hide:
| Line item | Per month | How it is known |
|---|---|---|
| Backups, 28 GiB | ~$0.30 | billed, after the free tier |
| Mesh | $8 | list price; free at our size, so we pay nothing |
| Metrics, logs, dashboards | $0 | self-hosted; retention is a disk decision |
| Tunnel, chat, CI, alerting, reconciler | $0 | free tiers and self-hosted open source |
| Infrastructure tooling | ~$8 | what the description calls under US$10 |
| The operator, agent subscription | $20–200 | published tiers — the same ladder for Claude Code and Codex |
| All in | $28–208 | dominated by the last row |
Two things that table makes obvious (Fig. 15). The cheap number is real but partial: US$8 a month buys the tooling and nothing else, and our own bill is nearer US$1 because the mesh’s free tier covers a two-person team. And the headline sits well below the total — the agent reading the alerts still bills monthly. Anyone reproducing this should budget for the bottom row, not the top.
On a managed cluster the arithmetic inverts: the control plane, load balancers, and egress become the dominant line, and electricity disappears into somebody else’s bill. The agent-ops layer costs the same either way, because it is the same layer.
What it adds up to
None of these pieces is exotic. An alert manager, a time-series database, a log store, a GitOps reconciler, Terraform, a chat surface, an agent with API access — all available to anyone, most of it free, none of it specific to a distribution.
What makes it work as a system is a set of constraints that each look like a limitation:
- The agent cannot write to production, so every change is reviewed.
- Dashboards cannot bypass code review, so nobody accumulates furniture unnoticed.
- Thresholds cannot be chosen by taste, so alerts mean something when they fire.
- A component cannot vouch for itself, so detection keys on quantities that take two parties to agree.
- Checks cannot be trusted until they have been made to fail.
- Destructive repairs cannot proceed without a live proof of safety.
- Infrastructure cannot change without a plan somebody read, so drift is found rather than discovered.
- Reports cannot omit the checks they failed to run, so silence never reads as health.
Every one of those is something the system refuses to do. It turns out that is what buys the thing it does: I do not have to watch it. Not because it never breaks — it breaks about as often as anything assembled from software — but because the parts that break announce themselves precisely, the recipient of the announcement is frequently not a person, and when it is a person, the message includes what to do.
A dashboard you have to monitor is an alert you have not written yet.